
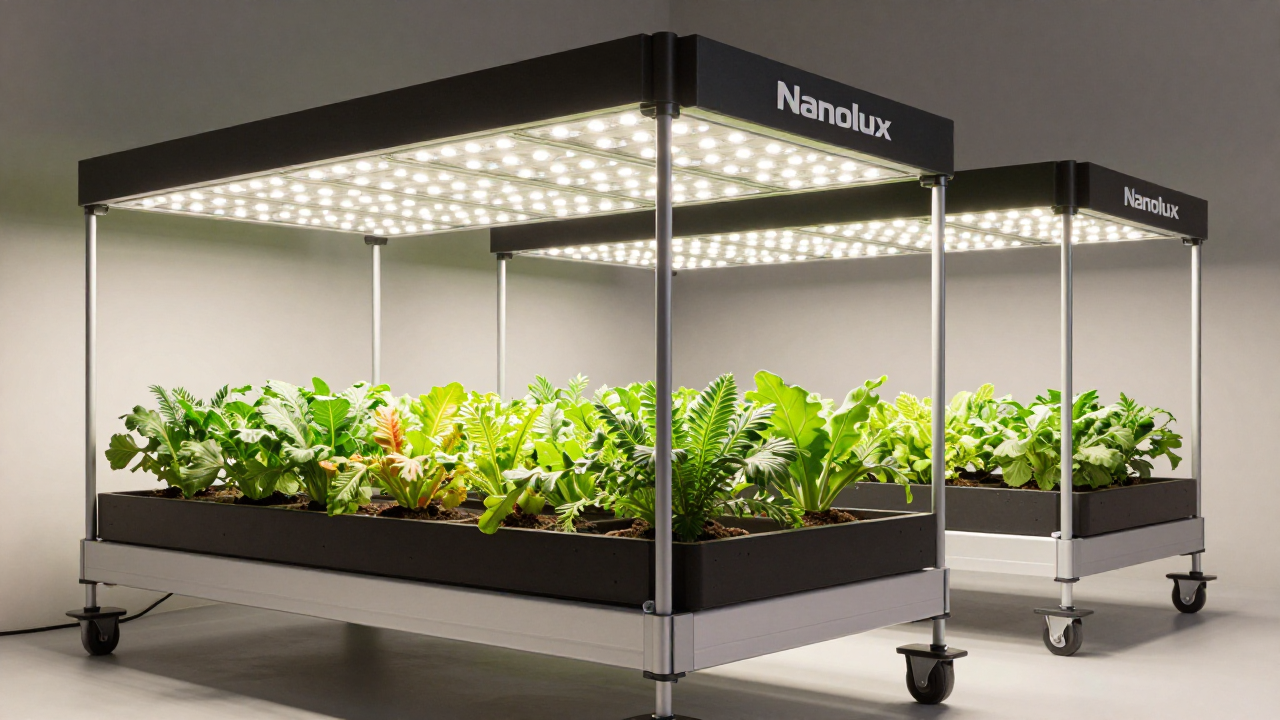
The $340,000 Lesson That Came From a Light Map Nobody Checked
If you’ve spent any time sourcing commercial grow lights in the past three years, you’ve probably been buried in spec sheets promising 3.2 µmol/J and a payback period shorter than a Netflix free trial. In August 2021, a controlled-environment lettuce grower outside Denver believed those numbers. He bought 620 LED fixtures from a brand we’ll leave unnamed — not ours — based purely on the photon efficacy rating and the price per watt. The install was clean. The wiring was tight. And six months later, he was staring at a $340,000 revenue gap.
Why? Because nobody had run a proper PAR map before hanging the first fixture.
The facility was a 22,000-square-foot warehouse retrofit. The grower had divided the room into eight identical zones, using the manufacturer’s recommended spacing. On paper, the average PPFD was 580 µmol/m²/s across the canopy. What that number hid was a variance of over 40% between the center of each rack and the edges. Lettuce heads under the hot spots bolted early. Those along the aisles stretched for light, producing loose, unmarketable leaves. By the time the operator caught the pattern, two full harvest cycles were compromised.
I remember our field team getting the call. This wasn’t a cheap light problem. It was a layout problem. A single, $800 PAR meter and four hours of mapping could have caught it before a single seed went into a tray.
What makes this mistake expensive is how quiet it is. You don’t see it the first week. You see it at harvest, when the trim crew has to work three extra days and the pack-out rate drops 23%. And then you see it again on the P&L statement when the utility bill — despite the high-efficacy LEDs — is only 11% lower than the old HPS room, because the HVAC system kept fighting the uneven heat load.
The fix isn’t complicated, but it is specific. We now beat this into every new client conversation: demand a PPFD uniformity map (the standard we use internally is a grid with readings every 12 inches across the entire canopy plane, not just a 4-by-4 sample). Target a uniformity ratio of 85% or higher — that’s the minimum PPFD divided by the maximum, expressed as a percentage. Anything below 80% will cost you either yield or unnecessary supplemental lighting. And when you compare fixtures, don’t stop at the IEC 62471 photobiological safety report; ask for an IES file and run a ray-tracing simulation for *your* rack dimensions, not the idealized 5-by-5-foot square the datasheet uses. One more thing: the Denver grower still uses those same fixtures today, but we repositioned them on a staggered center layout and added 24 Nanolux under-canopy bars to the low-light edges. His uniformity jumped to 89% inside a month. The $340,000 was gone, but he didn’t lose a third cycle. That’s the only reason I can tell you the story — he’s still in business.
—
The Spectrum Gamble That Looked Great on Instagram
Grow light spectrum sells on color. If the fixture glows a deep, pinkish-purple, it signals “science” to many buyers. If it glows white, it signals “sunlight.” Neither signal means a damn thing unless you understand the ratio of red to far-red (R:FR) for your crop at its current growth stage.
In November 2020, a cannabis cultivator in Kalamazoo, Michigan, swapped out 200 double-ended HPS fixtures for a batch of “full spectrum” white LEDs from an overseas supplier. The fixtures were rated at 2.8 µmol/J, which was competitive at the time. The spectrum chart showed a solid blue peak and a broad phosphor hump. By week 5 of flower, the grow team noticed internode spacing had stretched well beyond their historical norms. Buds were loose. Trichome density was down.
The culprit was an R:FR ratio of 6.2, which the fixture’s datasheet did not disclose. Their previous HPS environment had been running closer to 3.8, which promotes tighter internodes and denser flower structures during mid-to-late bloom. The plants weren’t starved for light; they were getting the wrong morphological signals. We know this because our lab in Sacramento ran a side-by-side with the same genetics under a spectrum-tunable fixture. When we dialed the R:FR down to 4.0 for weeks 4 through 7, the stem elongation stopped and the calyx-to-leaf ratio returned to commercial spec.
The cultivator didn’t have to scrap the white LEDs. He added 18 dedicated far-red bar lights per room — which, let’s be honest, was a $22,000 bandage on a problem that a simple upfront specification query would have prevented. Now I sound like a nagging engineer, but that’s exactly the point: the spectrum chart in a brochure is marketing, not a crop recipe.
Actionable takeaway: before ordering more than a dozen commercial grow lights for a flowering crop, ask for the 660 nm to 730 nm ratio at the operating current you’ll be running. Not the “typical” value — the measured value from the production batch. If the vendor can’t provide it, walk. And if you’re growing multiple cultivars on the same light line, aim for an R:FR sweet spot between 3.5 and 4.5 during generative phases. Leafy greens and microgreens will do fine with ratios up to 8, no special far-red supplementation needed.
—
The Efficiency Trap: When Higher µmol/J Actually Raised the Bill
Here’s a chart I’d tape to the door of every commercial greenhouse if I could. It captures a mistake that came up three separate times in 2022 alone — once in a tomato greenhouse near Phoenix, Arizona, once in an Oregon strawberry vertical farm, and once in a cannabis propagation room in northern Nevada.
The Phoenix tomato grower saw the 3.4 µmol/J number and ordered 180 of those high-efficacy fixtures for a 30,000-square-foot bay. His logic was sound: half the watts, same number of fixtures, right? But the total photon output per fixture was nearly half that of the cheaper LED, because the fixture’s total wattage was so low. To reach a daily light integral (DLI) of 30 mol/m²/day — the target for his indeterminate tomato crop — he had to hang three times as many fixtures as the room layout originally allowed. His final electrical load was 900 watts per 4-by-4 zone, not the 300 watts he’d penciled into his business plan. And because the extra fixtures blocked airflow, his HVAC runtime increased 14% year-over-year.
We got called in after he’d already spent $111,000 on lights that were technically the most efficient on paper. Our recommendation was ugly but necessary: repurpose 120 of those fixtures for a new seedling room where DLI requirements are lower, and fill the main bay with a 600-watt LED that delivers around 1,800 µmol/s — basically the same photon output as the old HPS rigs, but pulling 40% less power. He took a bath on the resale, but the crop was saved.
The trap is subtle: efficacy (µmol/J) measures how efficiently a fixture converts electricity into photons. It does not tell you how many photons you get per fixture, nor how many fixtures you need to cover an acre. DLI = PPFD × (3600 × photoperiod) / 1,000,000. If you chase efficacy without recalculating the fixture count to hit your target DLI, you’ll undershoot — or you’ll stuff the room so full that the airflow penalty eats your electrical savings. Run the fixture-count math before you buy, not the watts-per-square-foot rule of thumb.
—
The Controller That Became a Paperweight
Sometimes the failure isn’t the light hardware. It’s the layer between the fixture and the person growing the plants.
March 2023, a greenhouse tomato operation in Stanislaus County, California, invested $37,000 in an advanced lighting control system — scheduled dimming, sunrise/sunset simulation, zone-level DLI tracking via a quantum sensor network. The lead grower had 18 years of experience. The system was commissioned correctly. Eight weeks later, all eight zones were running at 100% output from 6 AM to 8 PM, seven days a week. The controller was in manual override.
What happened? The interface assumed a level of digital literacy that the head grower — a brilliant plant pathologist — didn’t have time to develop. The daily DLI target had been set once during training and never adjusted for seasonal light changes. As cloud cover shifted through spring, the controller should have automatically compensated, but the sensor feedback loop had been disabled because “the graph looked wrong.”
We see this pattern a lot. A facility buys a Ferrari-level control system and leaves it in valet mode. The lesson isn’t “don’t buy controllers.” It’s that the interface has to be chosen for the team you have, not the team you wish you had. Our product group learned this the hard way in 2018, when we launched a controller with a feature set that took a 45-minute webinar to explain. We now ship every Nanolux controller with a physical, laminated quick-start card that has four settings — nothing more — and get the advanced features turned on only during an in-person walk-through. It costs us a few hundred bucks per install. It prevents a few hundred thousand in wasted crop cycles. I’ll take that trade every time.
—
If There’s One Thing to Take Home
Honestly, the lighting purchase is maybe 30% of the outcome. The other 70% is how you map it, measure it, and manage it. I’ve seen $80,000 lighting budgets turn a profit in eight months because the layout was tight. I’ve seen $400,000 budgets turn into an extended lesson in what not to do. The difference usually isn’t the brand label on the heatsink. It’s whether someone stood under the lights with a meter and verified what the spec sheet claimed — before sticking a single cutting into a rockwool cube.
If you’re planning a retrofit or a new build, get the IES file, run the PAR simulation for your exact rack configuration, and set a minimum uniformity threshold. If you’re in the U.S., the 2026 growing season will be shaped by even tighter margins; electricity rates in some agricultural counties have crept above 14 cents/kWh for the first time. That means the cost of a layout mistake is going up, not down. Measure twice, cut once — this century’s version of that old carpenter’s rule applies to commercial grow lights more than most people want to admit.
