
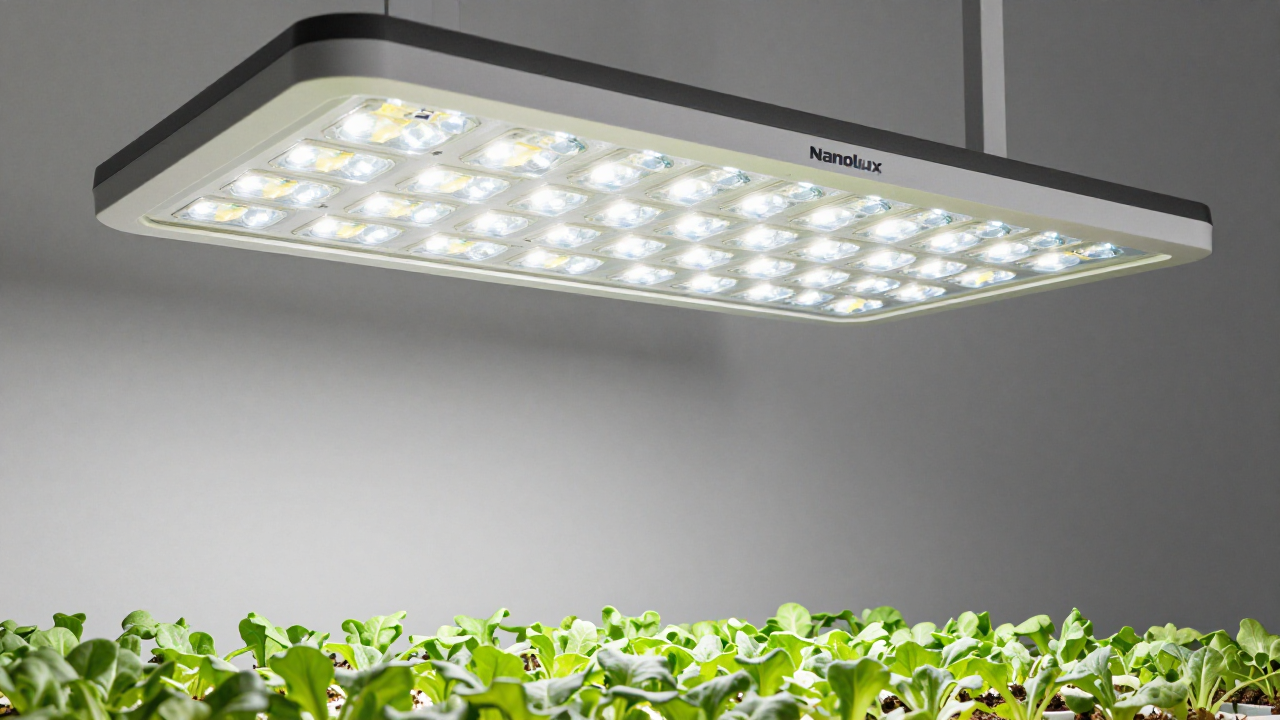
When 15 Acres of Basil Almost Bankrupted a Farm
It was August 2021, temperature hitting 107°F in Imperial County, California. A 15-acre greenhouse operation had just ripped out 800 HPS fixtures and replaced them with 720 LED bars from a startup no one had heard of six months earlier. The pitch was bulletproof on paper: 3.3 μmol/J, full spectrum, 50% less power draw, remote monitoring included.
Two months later, basil leaves were yellowing, intermodal spacing was all over the place, and daily harvest weight had dropped 31% versus the same planting window the year before. The owner, a guy named Miguel who had been growing for seventeen years, pulled me aside at a tradeshow in Vegas in October. “We lost $340,000 in three months,” he said. “I didn’t even know a light could cause that.”
That conversation forced me to rethink how we at Nanolux talk about commercial grow lights. The industry is thick with spec sheets and photon efficiency charts, but almost nobody walks new buyers through the failure modes you actually encounter on the ground.
So let’s do that.
The Trap Most Buyers Fall Into
The most expensive mistake in commercial grow lights has nothing to do with diode quality. It’s buying the wrong light for a specific canopy architecture and irrigation cycle, then trying to fix plant health problems with nutrients when the real culprit is light distribution.
Here’s what that looks like in a typical indoor leafy green setup. A grower calculates DLI targets, picks a fixture based on average PPFD at 18 inches, mounts everything, and watches the crop for two weeks. Growth looks uneven. Some plants stretch, others show tip burn. The immediate reaction is to tweak the fertilizer recipe. But the root cause is often a PPFD uniformity below 70% across the bench — meaning the center row is receiving 500 μmol/m²/s while the edges are sitting at 320. Most plants don’t handle a 180 μmol/m²/s gradient gracefully, especially under 18-hour photoperiods.
What trips people up is the daylight integral math. It’s punishingly simple.
DLI = PPFD × (3600 × photoperiod hours) / 1,000,000
If your PPFD map is uneven, the DLI at the bench edges might be 14 mol/m²/day while the center hits 24. That’s the difference between a healthy, compact head of lettuce and a stretched, bitter one. We’ve seen entire cycles written off because the grower couldn’t see the 14 mol zones on their PAR map.
A Tale of Two Warehouses in Denver
Let me give you a concrete comparison from Denver, February 2022. Two cannabis cultivators, both running 10,000 square foot flower rooms, both switching from double-ended HPS to LED top lighting.
Cultivator A went with the cheapest fixture that hit 2.8 μmol/J on the brochure. 1,000 units at \$290 each. Installation was fast, spectrum was “full white plus 660nm red,” and the rep promised 40% energy savings. Six weeks into flower, canopy temperature dropped enough that the plants’ transpiration rate slowed 22%, nutrient uptake stalled, and the grow team had to crank ambient room temperature to 82°F just to maintain leaf surface temperature in the mid-70s. That adjustment erased most of the predicted HVAC savings. Final energy reduction came in at 11%, not 40%.
Cultivator B spent more time on the front end. They tested three different spectrum configurations across eight benches, measuring not just dry weight but cannabinoid profile consistency across canopy zones. They ended up selecting a fixture with a broader blue peak and under-canopy interlighting bars to compensate for the lack of radiant heat. Their room temperature stayed at 76°F, transpiration held steady, and the energy reduction landed at a genuine 32% — without sacrificing yield per square foot.
The difference wasn’t technology. Both facilities used mid-power diodes on aluminum PCBs. The difference was the two months of systematic testing Cultivator B did before writing the purchase order. Most failures I’ve seen in this space come down to skipping that step.
Honestly, if I had a dollar for every time I watched someone buy 500 fixtures based on a 20-minute Zoom demo, I’d have retired by now. But I didn’t, so let me keep going.
Why “Full Spectrum” Means Almost Nothing
In April 2023, a vertical farm in Newark, New Jersey, learned this the hard way. They had deployed 12 layers of rack-mounted strips labeled “full spectrum, optimized for leafy greens.” The spectrum chart showed a massive spike around 660 nm and a smaller bump at 450 nm. The plants grew fast for the first ten days, then showed classic signs of shade avoidance — elongated stems, pale leaf margins, poor root mass density.
The problem was the green-to-red ratio. That particular “full spectrum” was so heavy in red that it tricked the phytochrome system into thinking the plants were in intense canopy competition, triggering stretch responses. For a multi-layer rack growing basil destined for local grocery chains, the visual quality was unacceptable. The farm had to scrap two entire grow cycles — 18,000 pounds of product — before they could get replacement lights installed.
This is the sort of failure that almost never appears in vendor case studies. Spectral composition isn’t just about “blue for veg, red for flower.” The photoreceptor crosstalk between phytochromes, cryptochromes, and phototropins can produce outcomes that contradict the simplified two-channel model floating around YouTube and trade blogs. If someone selling you a fixture can’t draw a phytochrome photostationary state (PSS) curve for your crop, you’re gambling.
I realize I just dropped “phytochrome photostationary state” into an already dense paragraph. That’s the kind of jargon that makes me sound like I’m showing off, but here’s the practical takeaway: if your light spectrum doesn’t match the morphology targets for your specific genetics and spacing, you’re going to see problems that nutrient adjustments can’t fix.
The Hidden Cost of Not Considering Maintenance
One last war story, then I’ll give you some actionable numbers. September 2022, a tomato greenhouse in Ohio installed 650 LED fixtures rated for IP65, with a claimed L90 lifetime of 60,000 hours. Eighteen months later, nine fixtures had failed completely, and thirty-seven others showed visible dimming in one or more banks. The failure rate was 7%, which is catastrophic when you need uniform PPFD across a 400-foot gutter line.
The root cause was condensation ingress. The fixtures were mounted with the cable glands facing upward — a tiny installation detail that allowed humidity to pool inside the housing during defrost cycles. The IP65 rating was technically valid, but the manufacturer’s installation manual never specified gland orientation for high-humidity cycles. The greenhouse operator assumed the rating covered them. It didn’t.
Total cost to replace failed units and reorient the remaining fixtures: \$41,000 in parts, plus three days of labor and lost production during the downtime. That stings even worse when you realize a single sentence in the installation guide could have prevented it.
What the Numbers Actually Look Like
When you’re evaluating commercial grow lights for a serious operation, here are the parameters that matter more than the headline efficiency number on the box. I’ve put them in a table because, honestly, I’m tired of writing long paragraphs.
One thing I’ve learned from two decades of watching growers blame themselves for light-related failures: testing one fixture on a single bench for a full 12-week cycle costs you maybe \$400 in electricity and labor. Rolling out 800 fixtures without that test can cost you a six-figure crop loss. The math is not complicated.
How to Not End Up in One of These Stories
I’m not going to give you a five-step plan because anyone claiming that has never been at 3 a.m. inside a 40,000-square-foot greenhouse with the CO2 system alarming. What I can give you are the patterns I’ve seen work across dozens of successful commercial installations.
First pattern: the people who test before they buy never call me in a panic six months later. That’s not a sales pitch, it’s a pattern. Set up a dedicated trial zone in your facility. Run production cycles from propagation through harvest under the light you’re considering, and track more than just fresh weight. Measure root development, cannabinoid profile, nutrient uptake rates, and branching structure at specific DLI levels. This sounds expensive until you compare it to the cost of replacing 200 fixtures mid-season.
Second pattern: installers who read the manual (and then ignore half of it and call the manufacturer anyway) have fewer water-damaged fixtures. Cable gland orientation, driver spacing for heat dissipation, mounting height tolerances at different ambient temperatures — all of these are failure points that don’t show up on a spec sheet. If the manufacturer won’t provide technical support for your specific environmental conditions, move on.
Third pattern: the growers who treat light as an integrated system variable, not a standalone input, end up with better margins. Your HVAC, irrigation, CO2 supplementation, and lighting all interact. A 3% increase in PPFD that causes a 1.5°F drop in leaf temperature might net out to zero biomass gain if your transpiration rate drops below threshold. I’ve seen this modeled in real time at facilities where the control system adjusts all four variables as a group. Those facilities rarely show up in failure case studies.
At Nanolux, we’ve spent twenty years watching people make mistakes, and then building fixtures that make those mistakes harder to commit. Not impossible — humans are creative — but harder. That distinction matters.
The greenhouse industry in 2026 is not going to be won by who has the highest photon efficacy on a datasheet. It’s going to be won by the operators who understand that light is a biological signal, not just an energy source, and that the costliest errors are the ones you don’t see until the plants tell you something went wrong three weeks ago. By then, it’s already too late to fix the current cycle.
That’s the part they don’t put in the brochure.
