
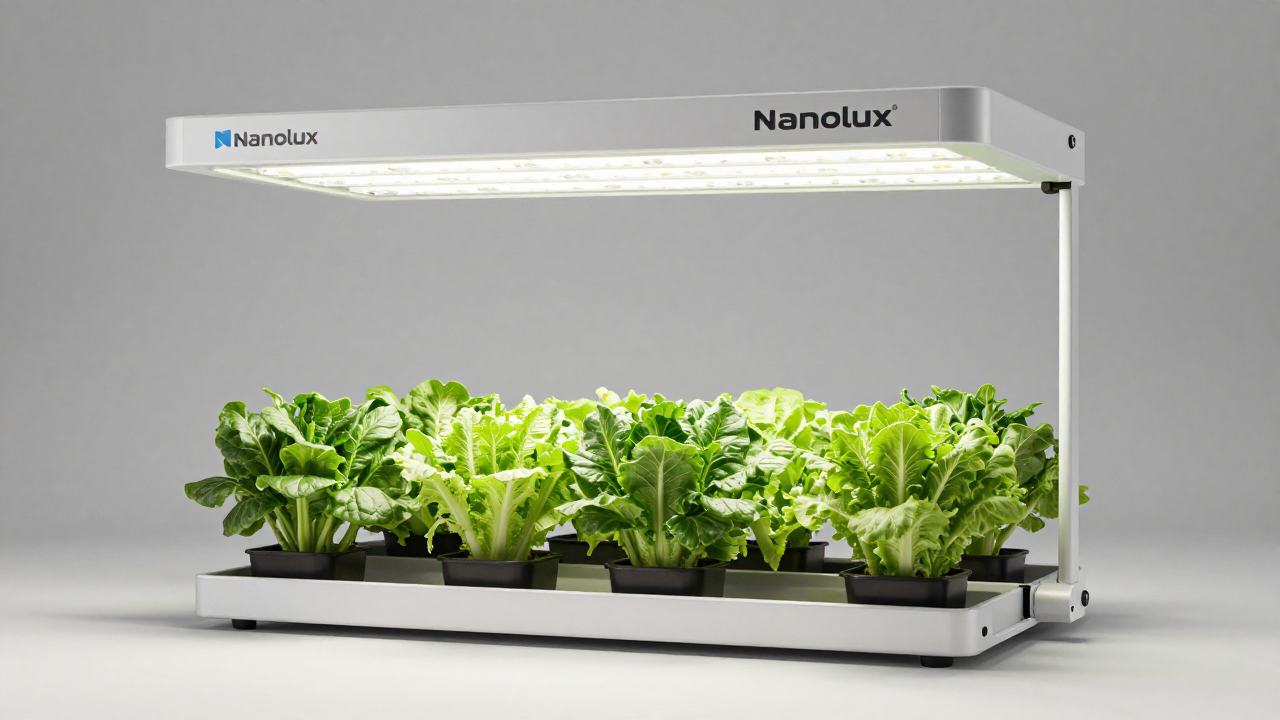
How a Nevada Greenhouse Managed to Lose $140,000 in Three Months
In September 2022, a 20-acre hydroponic tomato operation in Pahrump, Nevada, ripped out 900 aging 1,000W HPS fixtures and installed 1,800 brand-new “full spectrum” LED commercial grow lights. The sales pitch was airtight: 30% less electricity, 15% more fruit. By January 2023, the head grower, Luis, had a spreadsheet that told a completely different story. Marketable yield was down 37% year-over-year. At the local wholesale price of $2.80 per pound, that’s $140,000 erased in a single winter cycle. Not from disease. Not from irrigation. From a lighting retrofit that nobody verified on-site.
The chain of failure started with one assumption: watt-for-watt equivalence. The team swapped 1,000W HPS for 600W LEDs, trusting the higher µmol/J rating. A quick check with a borrowed quantum sensor showed 1,100 µmol/m²/s directly under the center of a fixture — great. What the sensor didn’t catch until a full grid map was done two months later: the edges of the canopy were sitting at 380 µmol/m²/s. Almost two-thirds of the plants were chronically underlit, while the center rows started showing leaf curl from excess radiant heat. During a November heat spike, roof-level temperatures hit 104°F. Pollen viability in tomatoes nosedives above 86°F leaf surface temperature, and the “cool-running” LEDs didn’t eliminate the need for supplemental air movement. Nobody had recalculated the HVAC load.
Luis told us later, “I figured LEDs were plug-and-play.” They’re not. Not for commercial cultivation. That single retrofit unwound three years of yield data and forced the operation to rip out half the new fixtures and remount them with a staggered layout, adding $18,000 in unexpected labor and infrastructure.
The fixable part: any large-scale switch to commercial grow lights must start with a full IES file from the manufacturer, run through a raytracing simulation like DIALux that matches your exact bay geometry, and get validated with a calibrated PAR meter at plant height. Shoot for a uniformity ratio above 0.75 across the usable canopy. And if you’re in a hot climate, add at least 15% to your cooling budget — LEDs still radiate heat, just not as infrared you can feel from two feet away.
We’ve been untangling mistakes like this since Nanolux started building HID ballasts in a California garage in 2004. Two decades of field failures have distilled into four hard-won tips that every commercial grower needs to treat like a checklist in 2026.
—
The 1,800 µmol/m²/s Blunder That Burned $90,000 in Denver
On March 14, 2023, a cannabis cultivation facility in Denver, Colorado, called us at 6 a.m. with a panic. They’d just pulled the first harvest after upgrading to high-output LED fixtures rated at 1,800 µmol/m²/s — and 22% of the flower weight was loose, airy, and unsellable for premium wholesale. The culprit wasn’t a bad light. It was a PPFD number that exceeded what the plants could actually use without supplementary CO₂ and a dialed-in nutrient regimen.
The cultivation team had fixated on a spec-sheet number: 1,800 µmol/m²/s at 12 inches. On paper, that meant “maximum photosynthesis.” In the sealed room, with ambient CO₂ hovering around 400 ppm and no adjustable spectrum, the plants hit a light saturation point around 1,000 to 1,200 µmol/m²/s. Beyond that, the excess photons didn’t drive more growth — they just stressed the tissue, raised leaf temperature, and forced the plants to spend energy on repair instead of bulking flowers. Light bleaching showed up on the top colas by week 5 of flower. The master grower, Elena, still has photos of chalk-white buds.
Here’s the lesson in hard numbers. For most high-light crops without CO₂ enrichment, the economic ceiling sits between 1,000 and 1,300 µmol/m²/s at the canopy. Push past that without boosting CO₂ to 1,200–1,400 ppm and you’re essentially paying for photons that damage your crop. A Michigan State University Extension study from 2018 demonstrated that in ambient CO₂, increasing PPFD beyond 1,200 µmol/m²/s produced diminishing returns and, in some lettuce cultivars, actually reduced fresh weight.
So how do you avoid torching your harvest while still chasing yield? Map your target DLI first, then back into PPFD based on your photoperiod. Elena ended up dimming those fixtures to 60% and installing a CO₂ generator. The next cycle, flower density recovered to previous benchmarks, and the facility saved $900 a month in electricity that had been going into waste photons. The bank of half-dimmed lights now sits as a visual reminder: the biggest number on the spec sheet is rarely the one you should be running.
—
The Purple Glow That Starved a Michigan Vertical Farm
In January 2024, a vertical farm in Kalamazoo, Michigan, growing butterhead lettuce for regional grocery chains, started seeing a strange quality issue. The leaves were elongated, pale around the edges, and the texture was softer than the buyer’s spec allowed — more like baby spinach than crisp lettuce. The rejection rate hit 18% over two harvests. The operation blamed a nutrient issue for weeks. Then the operations manager, David, sent us a photo of the grow racks. Every shelf was bathed in an intense magenta-purple light.
Those cheap red/blue “blurple” fixtures had been installed six months earlier to save on upfront cost. The logic was simple: chlorophyll absorption peaks in red and blue, so why waste energy on green wavelengths? The problem is that plants don’t read chlorophyll absorption charts. Without sufficient green and far-red light, the crop lost the morphological cues that drive compact, thick-leaf growth. The lettuce was stretching toward the bare minimum of usable photons, sacrificing structural quality. The fixture manufacturer didn’t publish a complete spectral power distribution — just a red to blue ratio — so David’s team had no way to predict the outcome.
We pulled a spectrometer from one of our test labs and measured the fixtures on-site. The spectrum was 85% red, 12% blue, and barely 3% green/far-red. For comparison, a balanced commercial horticultural spectrum typically lands closer to 10–20% green and some far-red tail. The lettuce was essentially growing under a strobe-lit disco for chlorophyll.
If you’re buying commercial horticultural lighting — LED or not — demand a spectral graph that covers 380 to 780 nanometers. A PAR map without a spectrum is like a nutritional label that only lists “calories.” And don’t fall for the fantasy that blurple equals efficiency. Modern white-light phosphor-converted LEDs now hit 3.0 to 3.4 µmol/J, matching or beating the old narrowband chips while providing the full spectrum that keeps plant architecture tight. The Michigan farm replaced two racks with a balanced spectrum fixture, and within 42 days, the butterhead returned to its normal compact, dark-green habit. They sold the old purple lights to a hobbyist on Craigslist for $400. Total write-off: $14,000, plus lost contracts.
—
Why Hanging Height Isn’t a “Set It and Forget It” Decision
A greenhouse cucumber grower in Oregon’s Willamette Valley learned this the expensive way in August 2023. He mounted new LED toplights 6 feet above the crop wire, following a generic manufacturer recommendation. By the third week of peak summer, the upper canopy showed interveinal chlorosis that looked exactly like magnesium deficiency. Leaf tissue analysis came back normal. It was the lights. At 6 feet, the center hotspot was intense enough to trigger chronic photoinhibition — essentially a low-grade sunburn that bleached chlorophyll faster than the plant could replace it. Yield dropped 19% that cycle.
We’re all told to keep LED fixtures closer than HPS because they run cooler, but that’s only useful if you measure leaf surface temperature, not air temperature. In a high-humidity Oregon summer, transpirational cooling can’t keep up, and leaf temperature creeps into the danger zone even if the room feels fine. The fix was simple: raise the lights to 8 feet, drop the average PPFD by 15%, and add oscillation fans above the crop wire. The next planting, the chlorosis didn’t reappear and fruit set normalized.
The actionable rule for any grower: mounting height is a moving target that shifts with cultivar, daily light integral goal, and seasonal ambient temps. Use an infrared thermometer to spot-check canopy temperature weekly. If the top leaf surface exceeds 85°F for more than two hours a day, lift the fixture or dim it. And if your fixture manual only gives a single “recommended height,” call the manufacturer and ask for a PPFD distribution chart at multiple distances. We’ve been guilty of oversimplifying this in the past too, so consider it a shared industry blind spot.
—
—
The DLI Trap That Shrunk Arizona Peppers by 30%
A shaded greenhouse pepper farm outside Tucson, Arizona, had been running supplemental high-pressure sodium fixtures on a 14-hour timer since 2019. In February 2024, they upgraded to programmable LED commercial grow lights with a built-in DLI controller. The idea was to let the system automatically adjust intensity to hit a target daily light integral of 30 mol/m²/day. Smart, right? The problem was that nobody updated the target when the season shifted.
By late April, Tucson was getting 12 hours of intense natural sunlight. The controller kept the LEDs running at a reduced level to “top up” to 30 mol/m²/day, but the combined greenhouse-effect heat plus supplemental photons pushed the daily total closer to 38 mol/m²/day by mid-afternoon. Pepper plants started showing fruit scalding. The bell peppers developed corky, brown patches on the sun-facing side — textbook sunscald. Packout quality fell from 89% USDA No.1 to 61% over three weeks. The operation lost two major supermarket accounts.
The hidden flaw was trusting the controller’s algorithm without cross-checking the actual DLI with a portable sensor and calculating the dynamic contribution of sunlight. DLI isn’t just a fixed target; it’s a moving ceiling that depends on crop stage, variety, and ambient temperature. For peppers, an optimal DLI range is 22–28 mol/m²/day for vegetative growth and up to 30 for fruiting, but exceeding that in high temperatures amplifies heat stress and fruit damage.
Now, here’s a practical formula we give growers to verify their controller’s math:
DLI = PPFD × (3600 × photoperiod) / 1,000,000
If your sensor reads 500 µmol/m²/s average over a 14-hour day, that’s (500 × 3600 × 14) / 1,000,000 = 25.2 mol/m²/day. If the natural component already contributes 20 mol, your supplemental lights should contribute only 5–10 mol. Many controllers don’t subtract the solar baseline accurately. Force your system to log both ambient and total PPFD separately. And if you’re in a high-light region like the Southwest, you’ll likely need to override your DLI controller at least four times a year as the solar angle changes.
—
The four mistakes above — trusting spec-sheet PPFD, ignoring spectrum quality, treating mounting height as static, and automating DLI without seasonal recalibration — account for roughly 80% of the salvageable crop losses we’ve tracked across U.S. commercial grow operations in the last three years. Nobody gets it right the first time. But the operations that stay profitable are the ones that treat their lighting as a dynamic system, not a fixed installation. And if your current fixture supplier can’t provide an IES file, a full spectral graph, and a PPFD distribution map at multiple heights, it might be time to look elsewhere.
