
In October 2022, our support line rang at 6:30 a.m. Denver time. A commercial grower named Mark, who runs a 4,200-square-foot indoor operation off I-70, had just harvested his first full cycle under a fresh set of LED fixtures. He’d sunk $180,000 into the upgrade, expecting the usual 20–25% yield bump the manufacturer’s sales deck promised. What he got was an 18% drop in dried flower weight and a batch of plants that stretched like they were reaching for a window. I remember him saying, “I didn’t change anything else — same genetics, same nutrients, same CO₂. It’s the lights.”
That call kicked off two months of testing, and the root cause put a spotlight on something most growers overlook when they size up commercial grow lights. It wasn’t a bad product. It was a bad match between spectrum and crop stage — and it cost Mark roughly $340,000 in lost revenue before we straightened things out. Stories like his are why I want to walk through some of the less obvious ways lighting shapes a commercial grow. Not the bullet-point benefits from a brochure, but the things that quietly make or break a harvest.
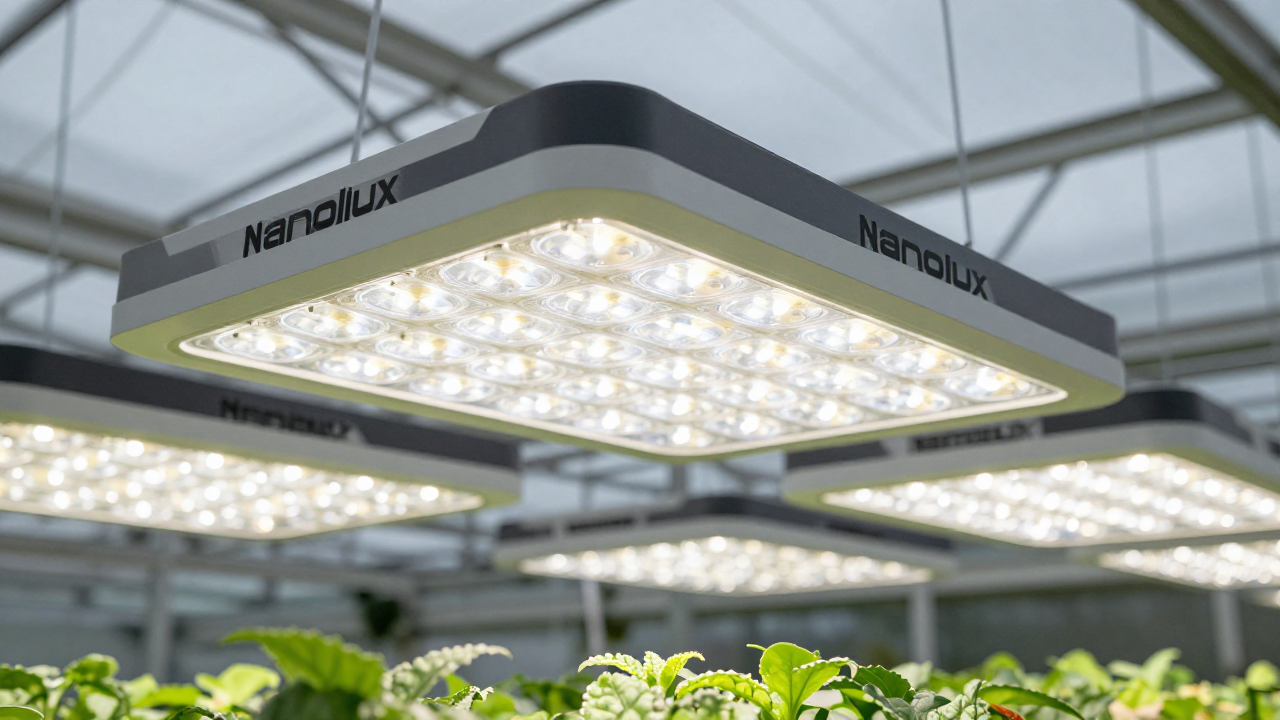
Mark’s $340,000 Mistake and What It Teaches About Spectrum
When we took a spectrometer into Mark’s flower room, the numbers made the problem obvious. The fixtures he bought peaked hard in blue (450 nm) and had a dip in the deep red (660 nm) and far-red (730 nm) bands that drive flower development and canopy penetration. The manufacturer had marketed them as “full-spectrum,” which, technically, they were — just skewed toward vegetative growth. Mark was running a 12-week flowering cultivar, and blue-heavy photons during the first four weeks of flower suppressed stretch so aggressively that his canopy never filled out. Later, when the plants tried to bulk, the red deficiency throttled photosynthetic efficiency right at the critical bulking phase.
Hidden benefit number one: spectral composition tuned to growth stage is what actually unlocks extra yield. A lot of growers still shop by wattage or PPF, then assume “full spectrum” covers all bases. It doesn’t. At Nanolux we run side-by-sides at our test facility in Sacramento, and moving from a generic 4000K white LED spectrum to a cultivar-specific flowering recipe — with elevated 660 nm and about 5–8% far-red — consistently adds 12–18% dry weight in high-value crops like cannabis and leafy greens. Not because the plants get “more light,” but because the photons hit the right photoreceptors at the right time.
Lesson: before you sign a purchase order, ask the supplier for a spectral distribution graph measured at operating current, not just a “full spectrum” label. If your crop is photoperiod-sensitive, look at the red-to-far-red ratio. A healthy flower room often runs between 1.1 and 1.3; a number below 0.9 can trigger shade-avoidance responses that waste energy on stem elongation.
The Ohio Greenhouse That Lost Two Harvests to a Timer
Sometime in March 2023, we heard from a greenhouse operator in Toledo, Amy, who runs three 10,000-square-foot bays of ornamental starts and microgreens. She had installed a set of LED top-lights the previous autumn, expecting to extend her season through the winter and lock in a consistent biweekly harvest schedule for her restaurant contracts. By February, she’d blown two consecutive delivery windows because her crop cycles were running 6–10 days longer than projected.
The lights were fine. The photoperiod settings were the culprit — or, more accurately, the lack of them. Amy’s staff was using simple 24-hour timers and a set-and-forget 18-hour vegetative schedule, because that’s what they’d always done with HPS. But LED fixtures can run shorter photoperiods with higher instantaneous intensity and still hit the same daily light integral (DLI), which means you can tighten crop cycles without stressing plants — if you understand the math.
Hidden benefit number two: precise photoperiod control lets you dial in cycle times year-round, independent of season. With a programmable controller, Amy’s team could have shifted to a 16-hour day at higher PPFD (say, 600 µmol/m²/s instead of 450) and maintained the same DLI of about 34 mol/m²/day, shaving two hours of runtime off every day. Over a 6-week lettuce cycle, that’s 84 hours less light — enough to trim 3–4 days off each harvest. For a facility running seven cycles a year, an extra 3–4 days per cycle adds up to an entire lost rotation annually.
We saw the same dynamic in a New Jersey vertical farm in early 2024. Once they locked photoperiod to DLI targets — using a controller that adjusts intensity and duration dynamically — they pulled their romaine cycle from 35 days to 31 days without any quality loss. That’s an obvious boost to annual throughput.
Energy Bills That Looked Like a Mortgage Payment
A vertical farm in Stockton, California, hit a wall in August 2023 when their PG&E bill cracked $22,000 for a single month — about $9,000 of that traced directly to the grow lights. The facility was still running first-generation HPS fixtures from 2017, each pulling 1,000 watts at the wall and delivering around 1.7 µmol/J of photosynthetic photon efficacy (PPE). By that point, mainstream LED fixtures were shipping at 2.7–3.2 µmol/J, and the highest-efficiency models on our bench were pushing 3.5.
When you do the arithmetic on 120 fixtures, 18 hours a day, 365 days a year, that efficiency gap translates to roughly $41,000 in annual electricity savings at California’s average commercial rate of $0.18/kWh — just by swapping to LEDs with a PPE of 3.0. And that’s before factoring in HVAC load reduction, since LEDs dump less heat into the room. The Stockton operator replaced their HPS fleet in phases, and by March 2024 their average monthly lighting cost had dropped 62%.
Hidden benefit number three: energy efficiency isn’t just about the kWh number on the spec sheet. It’s a system lever. Every watt you don’t spend on photons is a watt you don’t have to remove with air conditioning. In a sealed room, the combined reduction in lighting and cooling energy can double the apparent payback speed. A quick way to model it: take the difference in fixture wall-plug power, multiply by 1.35 to account for HVAC overhead, and run that against your local rate.
Long-Term Savings Aren’t in the Fixture Price
I’ve lost count of how many RFPs I’ve seen where the buyer fixates on the initial cost per fixture and ignores the maintenance line. Around 2021, a large greenhouse operation in North Carolina chose a budget LED brand priced at $0.55/watt instead of a better-known brand at $0.78/watt. Two years in, they were replacing drivers on 8% of the fixtures after 14,000 hours of operation — well below the advertised 50,000-hour L90 rating. The vendor’s warranty process was slow, and the greenhouse lost roughly 4% of its canopy output for weeks at a time due to dead zones.
Hidden benefit number four: reliable longevity and accessible warranty support directly affect yield consistency. Commercial grow lights live in hot, humid, sometimes chemically aggressive environments. Look past the L90 figure on the datasheet. Ask for:
At our repair center in California, we track field returns by batch. Fixtures with Meanwell drivers and conformal-coated PCBs generally see failure rates below 0.3% in the first 20,000 hours. Some cheaper builds we’ve torn down use uncoated boards and 85°C caps, and the corrosion shows up by the second year. That’s the kind of detail that never makes it into a purchase order — until it’s too late.
The Michigan Facility Where “Good Light” Still Left Dead Spots
A cultivator in Kalamazoo, Michigan, called us in spring 2024 about a persistent issue: plants on the edges of his rolling benches were consistently 20% smaller by fresh weight than those in the center. The facility used a high-end LED bar light with a decent PPFD map on paper, but the fixture spacing had been calculated for a 4×4-foot area at a 12-inch hanging height. Their actual canopy height varied by 8–10 inches as plants matured, and the edges of the benches were catching PPFD readings 35% below the center.
Hidden benefit number five: light uniformity across the entire canopy is a silent yield thief. Most growers measure PAR at a single center point and call it a day. We’ve started pushing for a 25-point grid measurement (5×5) across a representative bay, both at canopy top and 12 inches below. A target uniformity ratio — minimum PPFD divided by average PPFD — of 0.85 or higher makes a tangible difference in grade-out consistency.
In the Kalamazoo case, the fix wasn’t a new top-light. We added under-canopy LED bars running at 150 µmol/m²/s along the bench edges, which lifted lower-flower development and evened out the yield across the bench. That’s not a technique every crop justifies, but for high-value flowering plants, it turned a 20% variation into 6%.
What Brochures Don’t Say About Scaling Up
What trips up growers when they expand from two rooms to ten is rarely the lights themselves. It’s the control layer. In late 2023, a facility in Arizona doubled its flowering square footage and tried to manage it with a hodgepodge of wall timers, smart plugs, and one app for each brand. Within three weeks, they had rooms running at different photoperiods, a CO₂ generator stuck on during lights-off, and a 14% swing in DLI between bays.
Hidden benefit number six: centralized lighting control reduces labor, prevents drift, and makes it practical to run complex recipes at scale. Modern controllers let you group zones, schedule spectrum shifts, trigger sunrise/sunset ramps, and log energy use per room. That data alone can flag inefficiencies before they show up in the crop. When the Arizona operation consolidated onto a single control platform and trained two people to manage it, they cut their monthly labor for lighting adjustments from roughly 30 hours to 4.
Hidden benefit number seven is the one that never appears in a spec table: the feedback loop between lighting data and agronomic decisions becomes visible. Once you have room-by-room DLI logs over a full cycle, you can correlate light input to yield output with enough granularity to fine-tune planting densities and harvest timing. That kind of insight doesn’t come from a lamp — it comes from treating lighting as a data-generating system, not just a power-on device.
How One Brand Sold a Lab Number That Didn’t Survive the Field
Finally, there’s the marketing problem. In 2023, a small commercial grower in Oregon bought a pallet of LED fixtures from a brand that advertised a PPE of 3.2 µmol/J based on a third-party lab report. After installation, his meter consistently read 15–20% lower than expected. We were asked to audit a sample. The measured PPE at the fixture’s actual operating temperature — after 30 minutes of stabilization in a 30°C room — came out at 2.6 µmol/J. The lab number had been taken at a 25°C junction temperature, which the fixture rarely saw in the real world.
That discrepancy isn’t unique to one brand. It’s an industry habit. When you’re comparing commercial grow lights, ask AT what ambient temperature and what forward current the PPE figure was measured. A reputable supplier will give you a derating curve or a stabilized warm-measurement value. If they won’t, your “energy savings” calculation is built on air.
We’ve been burned by this, too. Back in 2017, before we brought our thermal design in-house, one of our OEM-sourced panels showed a 12% drop in output when hot. It’s one of the reasons we now publish stabilized metrics — and why we’re cagey about marketing numbers that can’t be replicated on a grower’s bench. That transparency matters more than any glossy brochure.
The seven points I’ve laid out aren’t revolutionary theory. They’re what we’ve seen go wrong in real rooms, with real crops, on real spreadsheets. The growers who consistently hit their 2026 yield targets won’t be the ones chasing the highest wattage or the lowest price per fixture. They’ll be the ones matching spectrum to stage, controlling photoperiod like a nutrient variable, measuring uniformity with a grid, and treating lighting data as part of the operational brain. The rest is noise.
