
Last October, a licensed grower in Tulsa, Oklahoma called our support line at 4:17 p.m. on a Friday. He had 3,200 square feet of leafy greens — butterhead lettuce, arugula, kale — that should have been ready for harvest in six days. Instead, the leaves were leggy, pale, and bitter. Anthocyanin development was almost nonexistent. He’d been running a set of budget LED panels he’d sourced online, rated at “1000W equivalent” but drawing only 394 watts at the wall. The fixtures hung 14 inches above the canopy, and his light meter was reading 180 µmol/m²/s at the leaf surface.
That grower lost 42% of his revenue that crop cycle. Not because he bought cheap lights — plenty of growers start with tight budgets and scale up. He failed because he planned his lighting around a spec sheet rather than his crop’s actual daily light integral (DLI) requirement. And that’s the pattern we keep seeing, year after year, from California greenhouses to Michigan vertical farms: operators treating commercial grow lights as a commodity purchase rather than an agronomic decision.
That’s what this guide is about. Not what the manufacturers say you *should* do, but what we’ve watched hundreds of growers get wrong — along with how to avoid those same sinkholes in 2026.
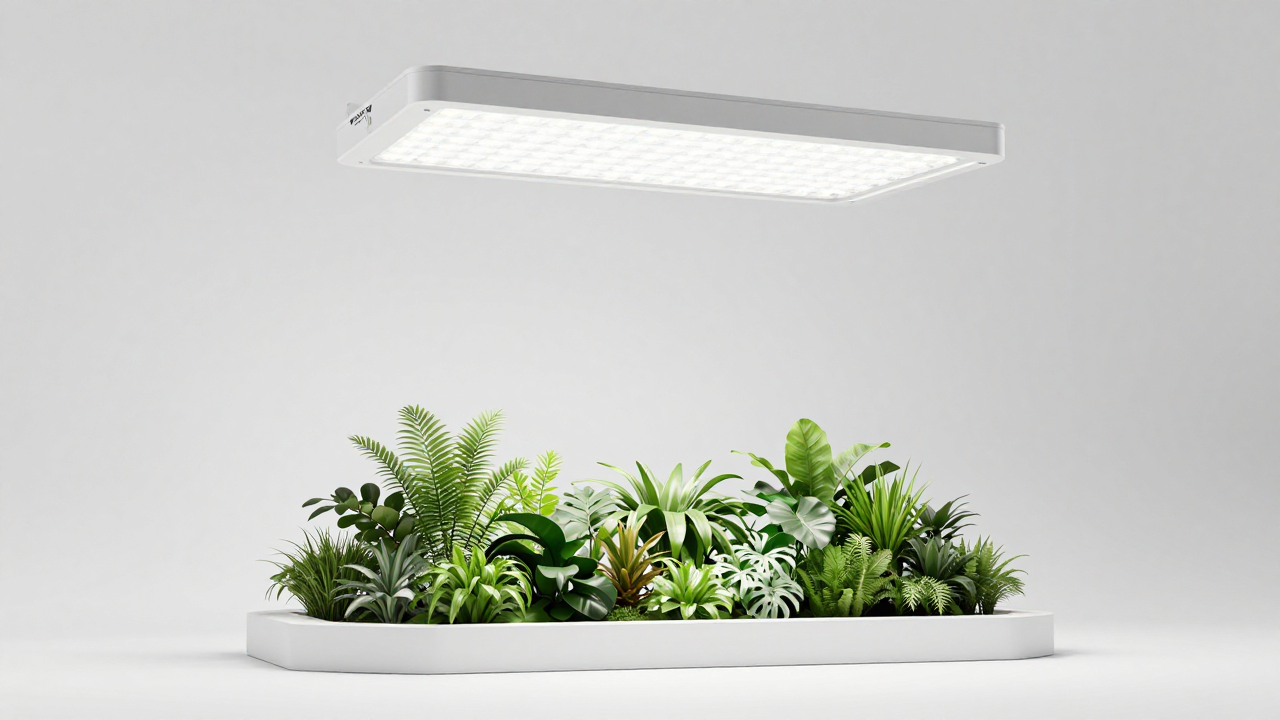
When “Full Spectrum” Actually Means Nothing
Around 2021, the term “full spectrum” became marketing wallpaper. You still see it pasted across product pages today. The trouble is, there’s no industry standard that defines it. A fixture can peak heavily in red and blue, throw in a handful of white diodes, and get labeled full spectrum. For a commercial crop? That’s often useless.
Take a tomato greenhouse in Leamington, Ontario — yes, across the border, but this applies squarely to U.S. operators because the lighting industry is cross-border. In January 2022, the grower retrofitted a 12,000-square-foot Venlo house with “full spectrum” bars boasting a 2.6 µmol/J efficacy rating. By March, fruit set was patchy. Brix levels fell below contract thresholds for a premium retail buyer. We got the call when their agronomist mapped the spectrum with a spectroradiometer. The 500–600 nm band (the green-yellow region that drives canopy penetration) was a cliff. PPFD at mid-canopy was fine, but lower leaves were senescing early because hardly any useful light was reaching that depth.
The lesson: spectrum isn’t just a PAR curve on a graph. It’s a penetration profile. For commercial crops with significant leaf area index (typically above 2.0), you need enough broad-spectrum energy — not just red-blue — to carry through the upper canopy. In 2026, any serious commercial grow light evaluation should involve at least a 15-minute conversation about spectral distribution across green, far-red, and UVA, not just the headline efficacy number.
We learned this the hard way ourselves at Nanolux. Early in our LED development, we tuned a prototype purely for quantum board efficiency, only to see exactly the same mid-canopy drop-off in a cucumber trial. The production units that shipped later incorporated dedicated 500–600 nm and 730 nm far-red channels, precisely to spread usable light deeper into a crop.
The Wattage Trap and the Ghost of HPS Shopping
Commercial growers who started with high-pressure sodium still think in watts per square foot. That habit is expensive when you’re converting to LED.
In March 2023, a large indoor cultivation facility outside Las Vegas, Nevada, replaced 1,000-watt double-ended HPS fixtures with 720-watt LEDs. They matched wattage nearly one-to-one — 36 watts per square foot — assuming equal output. Within three weeks, the crop showed photobleaching on upper fan leaves. A spot check measured 1,450 µmol/m²/s at 12 inches. For the photo-period they were running, the DLI was nearly double what their cultivar could handle.
We’ve seen this pattern in three states now: growers default to “wattage match” because it’s familiar, then end up either oversupplying light or under-running fixtures so aggressively they never recoup the LED investment. The fix is simple — calculate target PPFD from the crop’s DLI requirement, then work backward to fixture count, mounting height, and dimming schedule. For mixed-head or multi-tier operations, a mapping tool that accounts for overlapping beam angles stops you from guessing.
A quick reference on typical commercial targets:
These aren’t hard rules. They shift with CO₂ supplementation, temperature, and cultivar. But if your installed PPFD drifts 20% outside these bands, yield and quality consequences usually show up within two crop cycles.
The Dead Zone Nobody Measures
Here’s a failure that’s almost embarrassing to admit we’ve seen repeatedly. In fall 2024, an indoor berry facility in Colorado Springs installed multi-tier rack lighting with 320-watt linear LEDs. The farm manager carefully measured PPFD at 8 inches directly below the fixtures. All looked good — uniform 420 µmol/m²/s across the tray. But by week four, the plants along the outside edges of each rack were 30% shorter, with fewer fruit buds. What happened was a classic edge-drop: between fixtures, the light intensity fell to 180 µmol/m²/s at the perimeter, but nobody thought to map the whole footprint with the lights on and the trays in place.
Under-canopy and edge uniformity issues are the fastest way to turn a high-efficiency commercial grow light into a source of grade-B product. If your facility runs horizontal airflow fans, the fan beam pattern will create micro-shadow regions unless you deliberately overlap light distribution. One practical fix is to use a PAR map grid with at least 16 measurement points per 4×4-foot zone. It’s tedious, but a single poor harvest event from edge inconsistencies costs more than an afternoon with a quantum sensor.
In our own installs, we’ve started requiring integrators to submit a 3D light plan before we ship fixtures. Not a marketing render — an actual photon map, with estimated uniformity ratios at 6, 12, and 18 inches from the canopy edge. It catches the dead zone problem before a single seed gets planted.
Light Controllers and the Mistake of “Set It and Forget It”
Digital light controllers became common around 2020, and they’ve been both a godsend and a grenade. The godsend part: sunrise/sunset dimming, temperature-based output rollback, and zone grouping. The grenade part: users who program a light schedule once and never touch it for six months.
I’m going to say something imperfect here: we once shipped a controller with a default photoperiod setting that was designed for a specific lettuce variety trialed in Texas. It worked beautifully for that customer. Two other growers plugging in the same system ignored the fine print, ran the same schedule on basil and bok choy, and burned through an entire vegetative cycle with elongated internodes before calling us. Was it our fault? Partly. The manual should have screamed louder. But it also taught us that commercial grow light controllers can’t just be hardware — they have to come with crop-specific starting profiles, and easy overrides, or people will treat them like a microwave oven.
What 2026 Demands You Do Differently
If you’re purchasing or upgrading your commercial grow lights this year, the biggest shift isn’t hardware — it’s treating light as a yield input you actively manage, not a fixture you mount and forget.
The operators we see thriving have three habits in common. They budget for an annual PAR remap — not just at install. They factor in spectral aging, because even high-quality LEDs lose 3–5% photon output in the first 5,000 hours, and that drift affects flowering cues in photoperiod-sensitive crops. And they test at least two spectral ratios on a pilot rack before committing a full facility.
We’ve watched Nanolux fixtures running in a 40-foot sea container farm in Brooklyn since 2019, still maintaining 94% output after 18,000 hours. That’s not to sell you on the brand — it’s to make the point that reliability data should come from actual running hours, not an LM-80 projection sheet. Ask any vendor for a real third-party lumen maintenance report from a field installation, not just lab data. Many will fumble the question. That tells you everything.
