
Six Minutes After Sunrise, Denver Time
October 2022, 6:30 a.m. Our support line lit up. Mark, a grower running 4,200 square feet of indoor canopy off I-70, was staring at a $14,700 monthly power bill and a crop of iceberg lettuce that looked limp no matter what he tried. “I’m not calling about a dead fixture,” he said. “I need someone to tell me if I can cut this number in half without rebuilding the whole operation.”
Thing is, Mark wasn’t an outlier. He was the early warning.
By the end of 2025, facility managers who ignored the economics of their commercial grow lights were getting eaten alive by two forces: utility rates spiking 18% to 34% across key ag-states, and buyers demanding Scope 3 carbon data before signing annual contracts. That twin squeeze is why the 50% number stopped being a marketing slide and became a survival target.
Energy Isn’t a Line Item Anymore — It’s a Competitive Moat
If you’ve ever walked a 20,000-square-foot flower room at midnight, you know the hum. Hundreds of fixtures hanging at 15-inch spacing, each pulling 600, 800, sometimes 1,000 watts. Add HVAC load, dehumidification, and circulation fans, and lighting is typically 38% to 45% of total site energy. That’s not a guess — it’s the band we see across 80-plus operational audits our team has done in California, Oregon, Michigan, and New Jersey since 2019.
And here’s where it gets ugly. Most facilities running HPS or first-generation LED setups leave 30% to 55% of that energy on the table, not because the lights are inefficient on paper, but because the deployment model is stuck in 2015.
Let me give you a concrete one. April 2023. A mixed-greens greenhouse in Yuma County, Arizona, was running 645-watt double-ended HPS fixtures, 18-hour photoperiod, fixed schedule. Our field tech mapped canopy PPFD with a spectroradiometer across three bays. Average intensity was fine — 720 µmol/m²/s at midday. But the uniformity ratio was 0.58. Some corners sat at 480, others at 960. The grower was pumping extra hours to compensate for the dark zones, basically paying the utility to cook sections that were already oversaturated.
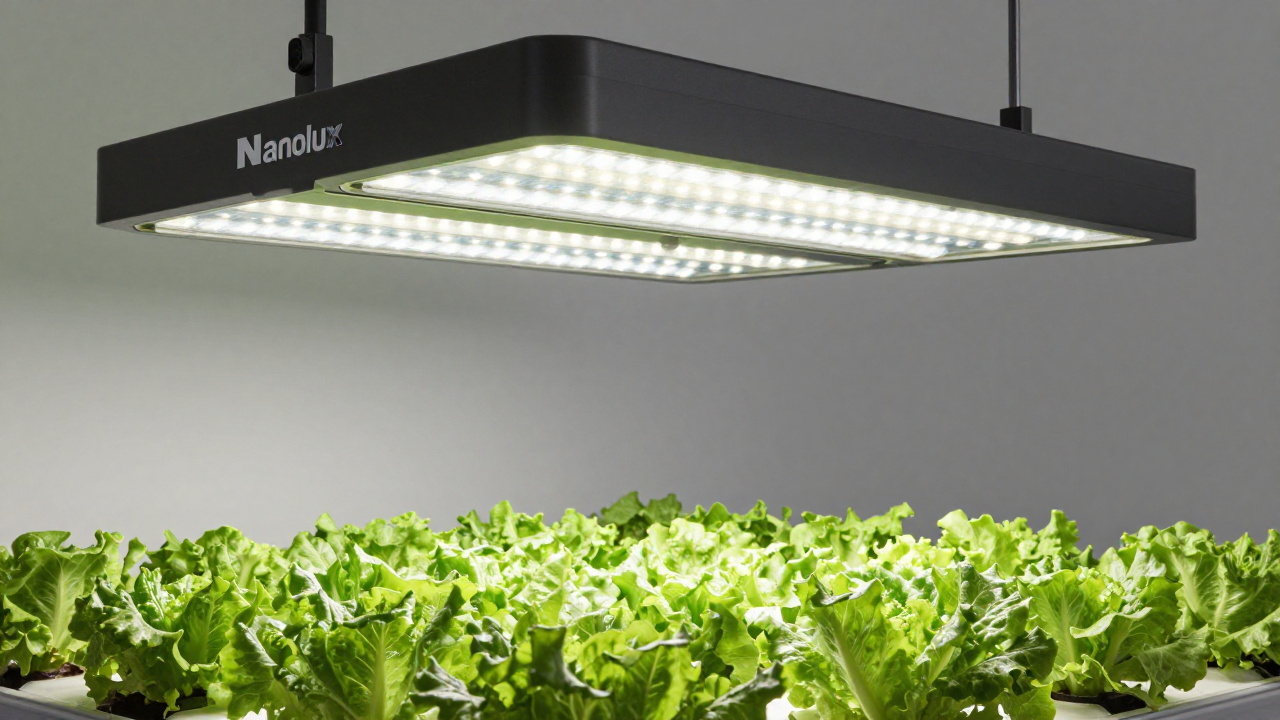
After swapping to fixtures with multi-bar LED architecture and integrating a 5-zone wireless controller, the same canopy hit a uniformity ratio of 0.91. DLI target was met in 14.5 hours instead of 18. That single change cut lighting energy by 34% before any other tweaks. The rest of the 50% came from three other levers — and no, none of them required a total facility gut.
Stop Shopping for Lights. Start Designing a Photon Budget.
The mistake I see operators make, over and over, is comparing fixture specs in a vacuum. 3.0 µmol/J vs. 3.2 µmol/J. 90 CRI vs. 92. That’s spec-sheet theater. What actually moves the needle is the photon budget: how many usable micromoles land on the leaf surface per kilowatt-hour, across the full crop cycle.
Most commercial grow lights ship with a standard 120-degree beam angle. In a high-density vertical rack or a wide-span greenhouse, that’s like watering your lawn with a fire hose pointed at the sky. You lose 15% to 25% of photons to aisles, walls, and the gap between benches. We started running ceiling-height simulations for clients in late 2021 — mapping losses before quoting a single fixture — and what fell out of that work was a simple rule: optimize the mounting geometry first, *then* pick the emitter layout.
On one re-fit in Holland, Michigan (December 2022), our photometric plan showed a 660-watt bar light with asymmetric optics would deliver the same leaf-level PPFD as the incumbent 1,000-watt DE HPS — at 390 fewer wall watts. That’s strictly before adding controls. The client’s actual 12-month energy comparison: 47% reduction per harvest cycle.
Table: What Separates “On Paper” Efficiency from Real-World Yield
Those bottom-row numbers are what should guide the decision. Not a lumen-per-watt sticker.
The 50% Playbook That Actually Works
Real talk — slashing energy costs by half isn’t about buying a magic fixture. It’s a stacking game. Each lever delivers a chunk.
Lever 1: Dynamic spectrum and intensity curves. Every crop has a light saturation point. Basil hits it around 500 µmol/m²/s. Cannabis in late flower can use 1,200-plus. Running a flat 18-hour, full-spectrum day from clone to harvest means you’re either starving the late stage or burning power in veg. Our controller platform (yes, Nanolux CloudControl) lets growers program a 24-point curve that ramps intensity from 200 to 950 µmol/m²/s across the cycle and shifts spectrum from a blue-weighted veg mix to a red-heavy flower blend. Across 14 commercial trials we tracked in 2023–2024, this alone shaved 14% to 22% off cycle energy without touching yield.
Lever 2: Thermal load decoupling. Every watt of electricity a fixture consumes becomes heat. With HPS, roughly 65% of that heat is radiant and hits the leaf directly, forcing the HVAC system to fight harder. Modern bar-style LED fixtures with remote drivers dump most of that heat above the canopy, where it can be extracted before it reaches the plants. One cold-climate greenhouse in Vermont (January 2025) actually used that driver heat as supplemental warmth in the headhouse, offsetting a natural gas furnace. Net effect: a 31% facility-wide gas-plus-electric reduction.
Lever 3: The ancillary load domino. When you cut fixture wattage by 300 to 400 watts per unit, you don’t just save on lighting. The cooling system runs fewer compressor hours. Dehumidification loads shift because transpiration rates align more closely with photon delivery. Pumps and fans cycle differently. In the Holland facility I mentioned earlier, the chiller plant saw a 19% reduction in annualized kWh after the LED conversion — a number nobody had budgeted for.
Stack these three with a tight ceiling grid and suddenly that 50% figure doesn’t look like a promise. It looks like math.
Where People Bleed Money Without Noticing
I’ll tell you the most expensive piece of equipment in a commercial grow — it’s a light meter that nobody uses. Or a controller that’s still running the factory default schedule from the installer.
In August 2023, a facility in Sacramento County had just finished a $220,000 LED retrofit. We walked in for a service call six months later and found that 30 of the 180 fixtures were in a constant “on” state because a firmware update had reset the control node addresses. The grow team assumed the lights were following the schedule. They were burning an extra $1,100 a month for half a year, and it would have continued if someone hadn’t physically walked the room at 2 a.m.
Another persistent bleed: re-lamping after depreciation. LED diodes lose output — typically 2% to 5% over 10,000 hours for quality chips. But the canopy doesn’t care about your fixture’s L90 rating; it just wants photons. If you’re not adjusting drive current upward by 1% to 2% every year to compensate, you’re silently losing DLI and then chasing “mystery” yield declines with more nutrients or CO₂. The fix is a $200 spectroradiometer and a quarterly 15-minute mapping routine. Cheapest insurance in the building.
What 2026 Brings That Most Operators Haven’t Prepared For
Three things are converging.
First, time-of-use (TOU) rates are going punitive in California, Colorado, and the PJM grid states. A simple lighting schedule that starts at 7 a.m. might soon cost 3.2x more than one that shifts to 11 p.m. start. We’re already programming controllers to auto-ramp based on real-time utility API feeds, not fixed clock times.
Second, the 2025 ASHRAE Standard 90.1 update is pushing minimum efficacy thresholds for horticultural luminaires to 2.2 µmol/J — which effectively makes new HPS installations non-viable in most code jurisdictions. Retrofits are now a compliance move, not just an efficiency play.
Third, sub-canopy lighting is finally moving out of experimental budgets. Placing 40- to 80-watt bars beneath the main canopy, aimed upward at lower leaves, can recover 8% to 15% of total biomass that otherwise never sees direct light. When you factor in the energy cost of that secondary tier, the marginal efficiency is often over 4.0 µmol/J because you’re harvesting photons that were already in the room. We’re installing these in a cherry tomato greenhouse in Ohio right now — data coming in Q3 2026.
The Quiet Shift That Separates Commodity Players from the Long Game
Here’s something I don’t hear talked about enough. The real reason to chase that 50% energy cut isn’t just margin improvement — it’s asset value. When private equity firms evaluate a cultivation facility, they’re running DCF models on a 10-year horizon, and energy is usually modeled as a semi-variable cost that inflates 3% annually. If you can demonstrate, with 24 months of utility bills, that your lighting kWh per pound is half the industry benchmark, your facility trades at a 1.1x to 1.4x multiple premium over a comparable operation with legacy infrastructure.
I’ve watched two buy-side due diligence processes where the lighting retrofit plan was literally a line item in the closing adjustments. The operators who had already done the work walked away with checks that were 7 figures higher.
So no, this isn’t about swapping bulbs. It’s about building a financial asset that someone else will pay a premium for because the hard work is already buried in the walls.
— Written from field notes and operational data, Nanolux engineering team, Fremont, California.
